A STUDY OF THE EFFECT OF BALLOON RELEASES
ON THE ENVIRONMENT
D. K BURCHETTE
Technical Advisor
Environmental Committee
National Association of Balloon Artists
July 29, 1989
ABSTRACT
|
Calculations were done to determine the fate of rubber latex balloons released into the environment. Aging tests were done to measure the degradability of latex balloons under a wide range of conditions. Based on the results, recommendations were made concerning rules to limit the impact of balloons on the environment. |
BACKGROUND
In the latter half of the 1980’s the public’s awareness of mankind’s harm to the environment was dramatically heightened by a number of ecologically significant events. These included major oil spills from tankers, evidence of global warming due to the burning of fossil fuels, plastic and other non-biodegradable garbage washing ashore and causing the closing of public beaches, publicity about depletion of the ozone layer which screens the earth from harmful levels of ultra-violet radiation from the sun, and so on.
A natural and worthwhile reaction to these and similar events has been that concerned citizens and lawmakers have begun to propose and enact legislation with the aim of protecting the environment and wildlife from the harmful activities of man. One small but symbolic effort along these lines has been legislation by some communities to restrict or ban the popular activity of “balloon releases” where hundreds or even thousands of helium filled balloons are released into the air to celebrate or publicize some occasion. This concern is based on the assumption that when these balloons come down they will become litter and/or cause harm to wildlife which may ingest them. Many people feel that balloon releases are an example of a “throw away” society where man wantonly discards plastics and non-biodegradable items which are ruining the environment.
On the other side of this issue are the many people who earn their livelihood from balloon releases and related activities. These include balloon manufacturers, helium suppliers, balloon wholesalers and retailers, and their employees. Most of the commercial balloon releases are arranged by small, family run businesses which make a living through balloon releases and through balloon deliveries and decorating. Balloon releases do much good through publicizing many worthwhile causes and helping to raise funds for charities and other non-profit groups. These balloon releases have proven to be valuable to commerce by virtue of their high visual impact in advertising.
This is a very emotionally charged issue, and in some cases legislation is being passed in great haste with almost no investigation into the facts involved. This report has been prepared to provide legislators and others with relevant facts and with the scientific evidence concerning this issue. Many of those in the balloon business share the same concerns for the environment and for wildlife as those who are proposing the legislation. However, they want laws on this subject to be written with a sound basis in fact. They do not want to be deprived of their livelihood in a symbolic gesture which does not have any real and commensurate benefit to the environment.
ABOUT THE AUTHOR
The author was born November 10, 1943 in Louisville, Ky. He received a Bachelor of Science Degree in Chemical Engineering from the University of Louisville in 1966, and a master of Science Degree in Chemical Engineering from the University of Louisville in 1967. His masters thesis concerned solid waste generation and disposal.
The author was employed in Research and Development for E. I. duPont de Nemours & Co., Inc., for twenty years working in the area of synthetic rubber product and process development. He retired in 1987 with the title of Senior Research Associate.
The author was named Technical Advisor to the Environmental Committee of the National Association of Balloon Artists (N.A.B. A.) in March, 1989.
CONCLUSIONS
- Calculations indicate that most helium filled latex rubber balloons that are released burst into tiny pieces about five miles above the ground.
- The small percentage of balloons that do not rise high enough to burst come down at less than one balloon per fifteen square miles.
- Field tests show that latex rubber balloons are very degradable on exposure in the environment under a broad range of exposure conditions including exposure to sunlight and weathering, exposure to water, and exposure to soil. The balloon samples show significant degradation after six weeks of exposure. The balloon samples appear to be degrading at about the same rate as oak tree leaves and about three times faster than small pieces of wood (oak and pine).
- The rate of degradation observed for the natural latex balloons should prevent their accumulation in the environment to levels which could be harmful.
- Based on the above results, it is recommended that balloons made from natural latex rubber be the standard for balloon releases. Balloons which are found to be less degradable than latex rubber should not be allowed.
OUTLINE
I. MECHANICS OF A BALLOON RELEASE
II. DEGRADATION OF BALLOONS IN THE ENVIRONMENT
III. COMMENTS CONCERNING RULES GOVERNING BALLOON RELEASES
A. Basis for Setting a Time Limit for Degradation
I. MECHANICS OF A BALLOON RELEASE
A. Where Do the Balloons Go After Release?
Millions of helium filled latex rubber balloons are released each year in the United States. Most of these are the toy rubber balloons under a foot in diameter. However, the National Weather Service releases about 50,000 five-foot diameter weather balloons to gather data (Ref. 1). Where do these go?
After the balloon is released, it rises through the atmosphere where the atmospheric pressure and the temperature decrease with altitude (Ref. 2). Using data supplied by the National Weather Service, the volume of a typical 11-inch diameter balloon was calculated at various altitudes. These calculations are contained in Appendix 1. The results show that the balloon rises to the height of about 28,000 ft (5 miles) where the volume increases to the point where the elastic limit of the rubber is reached. The temperature at this altitude is 40 °F below zero. Under these conditions of extreme elongation and low temperature the balloon undergoes “brittle fracture” where the rubber actually shatters along grain boundaries of crystallized segments (Figure 1). The resultant pieces of rubber are small as seen in comparison with the coin in Figure 1. These small pieces of natural rubber then float back to earth five miles below and are scattered over a wide area.
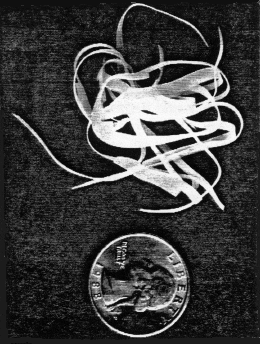 FIGURE 1. At high altitude the balloon undergoes “Brittle Fracture”
and blows apart into the pieces shown in the photograph.
In order to do this calculation it was necessary to determine the elongation at break for the rubber in the balloons. This was measured in the laboratory by marking spots on uninflated 11-inch balloons and measuring the distance between the spots as the balloon was inflated to the bursting point. Table l shows the results which agree with published literature for natural rubber.
| Balloon No. | Elongation, % |
|---|---|
| 1 | 800 |
| 2 | 725 |
| 3 | 737 |
| 4 | 662 |
| avg. = 731% |
The time it takes for the balloon to reach the height where it will rupture can be calculated using the following formula from Ref. 3:
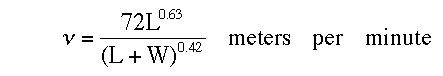
where L is the “free lift” in grams, or the mass in grams that the inflated balloon, carrying all its attachment (if any), is just able to support without rising or sinking, and W is the weight of the balloon, with attachments, before inflation.
For a typical helium filled 11-inch diameter toy balloon L was measured to be 11 grams and W was measured at 3 grams. Substituting these values into the above equation and converting the results to feet per second gives an ascent rate of
![]()
Dividing this into rupture altitude of 28,000 ft. results in a total ascent time of 4,753 seconds which is approximately 1.5 hours.
The vast majority of released toy balloons will have this fate, i.e., rise to a height of several miles and blow apart into very small pieces which then float back to earth. The very small pieces involved (Figure 1) and the wide scattering would suggest very little, if any, harmful effect on animal life. Biodegradation studies which are covered later in this report show this balloon material is about as degradable as tree leaves. It would be extremely far fetched to think that one of these small slivers of soft rubber could block the digestive tract of a sea turtle or dolphin.
B. Density of Balloon Fall Following a Release
A few percent of the balloons released will be flawed or develop leaks and will not rise high enough to rupture. These balloons will descend back to earth intact It is from this group that returns come following the release of “tagged” balloons. Usually well under 5-percent of balloons are returned following this kind of event.
It would be from this group of falling, intact balloons that any harmful effect on animal life would be most likely since the balloons which blow apart at high alti tude come down in very tiny pieces which are widely scattered.
Assuming that a full 10-percent of the balloons come down without bursting for a typical release of 500 balloons, it is conservatively calculated that the density of balloon fall would be no greater than one balloon in over 15 square miles ! These calculations are shown in Appendix 2. The results show that the descent of balloons following a release does not constitute a litter problem. Furthermore, this extremely low density of balloons from a release indicated that it would be very unlikely for the balloon release to have any measurable impact on animal life even if the balloon material was toxic, which it is not. Simply stated, one 3-gram piece of natural, biodegradable rubber in a several square mile area should have very little impact.
The above results are consistent with everyday observation and with common sense. Most of us never see balloons on the ground that have come from a balloon release, even though balloon releases occur very frequently throughout the country.
II. DEGRADATION OF BALLOONS IN THE ENVIRONMENT
Background
There are two types of toy balloons: “latex” balloons made from natural rubber, and so-called “foil” or “Mylar” balloons which are made from a metal coated plastic such as polyethylene or nylon. The foil balloons are not biodegradable.
Balloon releases almost always involve the release of the rubber latex balloons rather than the foil balloons. This is primarily due to economic considerations from those doing the release. Currently the foil balloons cost about a dollar each wholesale whereas the latex balloons cost only about ten to fifteen cents each. The following section of this report concerns only the latex rubber type of balloon.
Latex balloons are manufactured using a dipping process which involves dipping a ceramic mold into a coagulant such as salt water and then dipping it into natural rubber latex. This causes the latex to coagulate on the mold and form the balloon which is then washed, dried and then removed frum the mold.
Natural rubber latex comes frum the large forest tree Hevea brasisiensis which occurs naturally in the southern equatorial region of America. Rubber occurs in the Hevea tree as a latex, a milky liquid which is exuded when the tree is wounded or cut. Rubber is a straight chain polymer (Ref. 4) having the formula
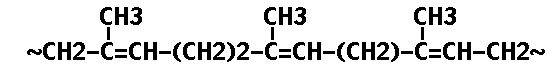
The unstabilized double bonds make it susceptible to degradation.
Latex rubber balloons are a totally natural product. They are essentially the coagulated and dried sap frum the Hevea tree with the addition of a tiny amount of non-toxic coloring. These balloons degrade in exactly the same natural manner as the Hevea tree from which they came degrades when it falls in the forest. Much of the concern over balloon releases is caused by a lack of understanding of this fact by the general public, including law makers. The public confuses natural rubber with man-made synthetic rubbers and plastics which are not natural products and in most cases are not degradable by natural means.
That natural rubber is susceptible to degradation through a number of different mechanisms is well known (Ref. 4, 5). Among these are degradation by exposure to ultra-violet radiation (sunlight), exposure to ozone and oxygen, exposure to weather, natural aging and bacteriological degradation.
The size and shape of the toy latex rubber balloons makes them even more degradable than the laboratory samples discussed in References 4,5. The rubber in an inflated balloon is stretched several hundred percent. This stretching greatly accelerates the degradation by ozone attack and oxidation. Also, as the balloon rises through the atmosphere following its release, it is expanded even greater and it is exposed to much higher doses of ultra violet radiation than it would receive at ground level. The inflation of the balloon followed by exposure to sunlight for a period of time is very important in the overall scheme of its degradation. Under the high stress of inflation with exposure to sunlight the balloon rapidly oxidizes. Within 15-minutes to an hour the balloon will change colors from a bright, shiny color to a dull and hazy color. Clear balloons turn white during this period. What is actually happening is that the surface of the balloon is being covered with thousands of microscopic cracks and fissures. This weakens the rubber and greatly increases the surface area for further degradation. The importance of this initial exposure and oxidation in the inflated condition cannot be overemphasized.
In the design of any test to measure the degradability of latex balloons following a release, the intial period of inflation with exposure to ultra-violet radiation must be adequately simulated in order to obtain realistic results.
B. Field Tests of Balloon Degradation
A number of field tests were begun on May 31, 1989 to measure the degradation of latex balloons under different aging conditions and to compare these results with the degradation of small pieces of wood and with tree leaves aged under the same conditions. It was hoped to obtain quantitative data for scientific documentation as well as qualitative data to which the average, non-technical person could easily relate. Results are summarized below.
1. Experimental Procedure
A total of fifty 11-inch latex balloons of different colors from two different American manufacturers were inflated with air and sealed with plastic clips. They were then hung from a clothesline suspended bewteen two posts outdoors for approximately 6 hours. It was a sunny day with the temperature in the upper 80’s. This inflation and the period of exposure to sunlight was done to simulate conditions of a balloon release.
After about 6-hours exposure, forty four of the balloons had ruptured due to oxidation, sunlight, and strain caused by an occasional breeze. This type of performance is within the normal range of performance.
The remaining 6 balloons were deflated and each was cut into four pieces of approximately the same size. These pieces were placed in a laboratory desiccator containing anhydrous calcium sulphate overnight in order to dry them for accurate weighing. The balloon pieces were then weighed to the closest one-thousandth of a gram and the results were recorded.
The balloon pieces were split ran domly into three groups for exposure as follows:
GROUP 1 – Exposure in contact with soil.GROUP 2 – Exposure in contact with water.
GROUP 3 – Exposure to weathering and sunlight.
Some small blocks of yellow pine measuring 3/4″ X l 1/2″ X l 3/4″ and some pieces of oak measuring 1/2″ X 3/4″ X 2″ were dried in a “Blue M” laboratory forced convection oven at 85 °C until they reached constant weight (about 8 hours). These dried pieces were cooled in the desiccator and weighed. These were then divided into the above exposure Groups l and 2.
In addition to the balloon pieces and the small blocks of wood, some green tree leaves were taken from a red oak tee for inclusion in the aging tests. This part of the test was qualitative since drying the leaves to constant weight at the beginning of the test would greatly accelerate their aging behavior.
Group 1 – Soil Exposure.
The samples of this group were placed into a plastic tray measuring 4″ X 12″ X 16″ together with about a one-inch thick layer of loose top soil. The samples were mixed randomly with the soil. Some of the samples were lying on top of the soil but in contact with it while other samples were buried by the soil. The bottom of the tray had been drilled with a few small holes and lined with a double layer of cheesecloth beforehand to allow rain water to drain from the tray without carrying out the soil. The tray was placed on the ground outdoors where it received about six-hours per day of direct sunlight.
Group 2 – Water Exposure.
The samples of this group were placed into a plastic tray measuring 4″ X 12″” X 16″” on the ground next to the Group l samples. The tray was then filled with water from a nearby stream. Every few days about a gallon of water from the stream was slowly added to the tray with the excess allowed to overflow. After a couple of weeks some green moss was observed growing in the tray. Also, it was observed that the rubber samples initially floated but sank to the bottom after a few days.
Group 3 – Sun and Weather Exposure.
This group contained only the balloon samples and the tree leaves. No wood samples were in this group. Initially the samples were tacked in an unfolded but unstetched position on one side of a piece of 2″” X 4″ lumber which was placed on the ground with the samples on the top side. However after only a week or two of aging some of the balloon samples began to stick to the wood so that it became difficult to remove them for weighing. In fact, one sample actually liquified and became a spot of rubber cement on the wood.
After two weeks these Group 3 samples were transferred to a teflon coated tray. The corners were taped with small pieces of “duct tape.” The tray was placed beside the other samples.
After one, two, four, and six weeks of exposure samples were removed from the trays and cleaned in distilled water. The balloon samples were dried in a desiccator for at least one week and then reweighed. Changes in the appearance of the balloons were noted.
Samples of each kind of wood were removed at two, four, and six weeks and cleaned in distilled water. The samples were then dried to constant weight (at least 8 hours) in a forced air laboratory convection oven at 85 °C. The dried samples were then cooled in a desiccator and weighed.
2. Results of Aging Tests.
Table 2 shows the results of aging the “Group 1 – Soil Exposure” samples. Qualitatively, the balloon samples appeared to degrade very much faster than the wood samples which were not very degraded in only six weeks as would be expected. The six weeks balloon sample resembled a tom, discolored piece of tissue paper. Figure 2 shows this balloon sample with an oak leaf aged under identical conditions. The balloon sample appears even more degraded than the oak leaf.
| Sample # | Color | Time (weeks) |
Start (gm) |
Final (gm) |
Percent Loss |
Notes |
|---|---|---|---|---|---|---|
| Balloon Samples | ||||||
| 13 | green | 1 | 0.628 | 0.622 | 0.95 | |
| 4 | red | 2 | 0.613 | 0.603 | 1.63 | 1 |
| 5 | pink | 4 | 0.566 | 0.553 | 2.30 | |
| 17 | clear | 6 | 0.703 | 0.728 | -3.57 | 2 |
| Pine Wood Samples | ||||||
| 1 | 2 | 11.988 | 11.951 | 0.31 | ||
| 4 | 4 | 12.021 | 11.957 | 0.53 | ||
| 6 | 6 | 12.023 | 11.847 | 1.46 | 3 | |
| Oak Wood Samples | ||||||
| 5 | 2 | 8.069 | 8.027 | 0.52 | ||
| 1 | 4 | 8.022 | 7.920 | 1.27 | ||
| 2 | 6 | 8.001 | 7.859 | 1.77 | 3 | |
| Notes: | ||||||
- – Reverted to sap like state. Broke apart easily.
- – Very degraded. Like tissue paper. Difficult to clean.
- – No visible degradation.
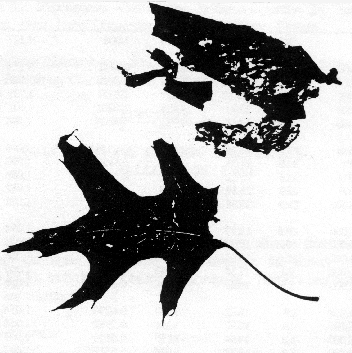
FIGURE 2. Balloon sample and oak leaf
after six weeks exposure to soil.
The results of weight loss in Group 1 through the first month indicate the balloons are degrading two to four times as fast as the wood samples. Unfortunately, it was found to be impossible to clean soil and mold from the six week balloon sample adequately enough for an accurate reweighing of just the rubber. The final soiled piece weighed slightly more than the starting piece. At an early stage in the degradation it was noticed that the balloon pieces became very sticky and revert to an almost sap-like state. This appeared be influenced somewhat by color. The six week balloon sample from Group 1 was initially clear. In all of the tests, the clear balloons appeared to degrade fastest.
This result shows that a degradation test for balloons based solely on weight loss could be very misleading. In addition to it being physically impossible to remove and clean a tacky sample which has small pieces of soil and sand stuck to it, one would expect the sample to actually gain weight initially as it begins to oxidize and add oxygen. A much more reliable method appears to be simply noting the qualitative nature of the balloon sample. Has it changed or not? Has it become discolored, cracked, brittle, soft, tacky, etc.
Table 3 shows the results for the “Group 2 – Water Exposure” samples. After six weeks the balloon samples appeared to be degrading at about the same rate as the oak leaves based on their appearance as seen in Figure 3. It was noted that both the leaves and the balloon samples looked a little better than in the other groups. For example the tree leaves were still partially green even after six weeks. Based on the weight loss data the balloons in this group appear to be degrading fastest.
| Sample # | Color | Time (weeks) | Start (gm) | Final (gm) | Percent Loss | Notes |
|---|---|---|---|---|---|---|
| Balloon Samples | ||||||
| 2 | red | 1 | 0.692 | 0.680 | 1.73 | 1 |
| 22 | yellow | 2 | 0.664 | 0.655 | 1.36 | |
| 18 | clear | 4 | 0.477 | 0.435 | 8.81 | 2 |
| 10 | green | 6 | 0.573 | 0.543 | 5.24 | 3 |
| Pine Wood Samples | ||||||
| 9 | 2 | 12.412 | 12.532 | 0.48 | ||
| 8 | 4 | 12.265 | 12.203 | 0.05 | ||
| 10 | 6 | 12.306 | 12.147 | 1.29 | 4 | |
| Oak Wood Samples | ||||||
| 11 | 2 | 8.392 | 8.281 | 1.32 | ||
| 6 | 4 | 8.266 | 8.055 | 2.55 | ||
| 7 | 6 | 8.230 | 7.996 | 2.84 | 4 | |
| Notes: | ||||||
- – Broke apart easily.
- – Reverted to sap like state.
- – Tacky. Significant loss in strength.
- – No visible degradation.
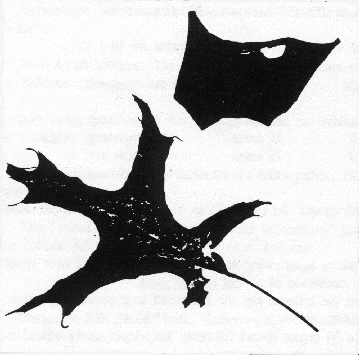
FIGURE 3. Balloon sample and oak leaf
after six weeks exposure to water.
Table 4 shows the results for the “Group 3 – Sun and Weather Exposure” samples. The balloons in this group appear tobe degrading as fast as the balloons in the other groups. Figure 4 shows the balloon sample at six weeks looks much more degraded than the oak leaf aged under the same conditions.
| Sample Number | Color | Time (weeks) | Start (gm) | Final (gm) | Percent Loss | Notes |
|---|---|---|---|---|---|---|
| Balloon Samples | ||||||
| 19 | clear | 1 | 0.544 | – | – | 1 |
| 12 | green | 1 | 0.584 | 0.576 | 1.40 | 2 |
| 7 | pink | 2 | 0.614 | 0.608 | 0.98 | 2 |
| 3 | red | 4 | 0.607 | 0.599 | 1.32 | 2 |
| 24 | yellow | 6 | 0.538 | 0.505 | 6.13 | 2,3 |
| Notes: | ||||||
- – Reverted to sap. Could not be removed for weighing
- – Broke apart easily.
- – Tacky.
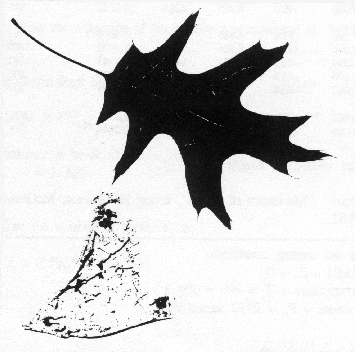
FIGURE 4. Balloon sample and oak leaf
after six weeks exposure to weather and sunlight.
3. Conclusions from Aging Tests
Based on the results through the first six weeks of aging the following conclusions can be made:
- Latex rubber balloons degrade about as fast as oak tree leaves under a wide range of exposure conditions in the environment including sunlight, weathering, soil, and water exposures.
- Latex rubber balloons degrade several times faster than small pieces of wood under the same exposure conditions.
- In a matter of weeks in the environ ment latex rubber balloons undergo very visible degradation in various forms. These changes include softening, decrease of strength, and tackiness which are all signs of a breakdown in molecular weight. On further aging the samples begin to crack and tear easily.,
- Weight loss is not a good criterion for judging degradation of latex rubber balloons. This is in part due to the difficulty in handling and cleaning partially degraded samples.
III. COMMENTS CONCERNING RULES GOVERNING BALLOON RELEASES
A. Basis for Setting a Time Limit for Degradation
As shown above, the density of balloons falling from a balloon release is on the order of one balloon per 15 square miles. This is extemely low and it would seem unlikely that an animal could find and eat enough balloon material to do harm under these conditions.
Any rule governing the time it takes a balloon to degrade should not be based on the principle of having it degrade before an animal could find it. It should instead be based on the goal of having the balloons degrade fast enough to prevent any appreciable accumulation of balloon material in the environment. In other words, if balloons degrade over a period of several months to even a year, they would not build up or accumulate beyond the initial density following fall. If balloons degrade over the period of several months, then a steady state condition is reached where balloons are dissolving out of the environment at the same rate they are entering it.
Much of the concem over balloon releases deals with possible harm to the sea turtle population. At a balloon fall density of one balloon per several square miles, it seems extemely unlikely a turtle could forage a large enough area to find enough balloons to do harm. It would take several months for a turtle to cover a 15 square mile area. If balloons were not degradable at all they would slowly accumulate in the environment until their density increased and the turtles might eat enough balloon material over a short enough time period to do harm. However, if the latex rubber in the balloons degrades even slowly, the density of balloon material per unit area of ocean will not increase beyond a low level.
A pilot study completed this year by Dr. Peter Lutz, Division of Biology and Living Resources. University of Miami (Ref 6), indicated that pieces of latex balloons fed to sea turtles did not cause them harm. It should be noted that prior to feeding them to the turtles, these balloon pieces were not even degraded or weakened by strain, oxidation, and exposure to ultra-violet radiation as would occur in a release. Among the conclusions from this study Dr. Lutz stated that any harm to sea turtles from ingesting balloon material would
“…depend upon the likelihood of turtles coming upon sufficient amounts of balloon material to be harmful.”
Based on the calculations concerning balloon fall and the results of the field degradation studies earlier in this report which showed balloon pieces become significantly degraded within a time period of several months, then accumulation of this material in the wild would be at a safe, low level that should not cause harm.
B. Suggested Rules for Degradability
In light of the above results concerning the degradability of “latex” balloons made from natural rubber, and in light of the extensive documentation in the literature on this subject, it would seem reasonable to make natural latex rubber balloons the standard in any rules governing which balloons are acceptable to release. In other words, the rules should allow the release of balloons made from natural latex rubber, but should not allow the release of balloons made from any material which is less degradable than natural latex rubber balloons. This rule would not allow the release of the “Mylar” foil coated type of balloons and would not allow the release of any balloons made from a synthetic rubber or plastic material which is less biodegradable than natural rubber.
Any testing of new compositions of balloon materials for acceptability could be performed like the field tests reported in Section II of this report. Natural latex rubber balloons would be included in the test as controls. If, after a few months of exposure, the new composition was found to be less degraded than the natural rubber balloons, then the new composition would not be allowed. Visual inspection of the samples would be used to determine degradation. This would include sigus of degradation such as loss of strength, cracking, softening, loss of elasticity, tackiness, etc.
Again, any test of degradation of balloons should start with inflating the balloons fully and exposing them to direct sunlight for several hours in order to simulate a balloon release. This is most important since it begins the degradation process. In reality, the intensity of ultra-violet radiation at the high altitudes the balloon would reach is much greater than at ground level (Ref 7). Therefore it would be accurate to expose the balloons to sunlight for up a few days before starting the aging process.
C. Other Suggested Rules Governing Balloon Releases
The National Association of Balloon Artists (NABA) has proposed a number of other rules governing balloon releases aimed at minimizing any impact on the environment and promoting safety. These are restated below and should be included in legislation regulating balloon releases.
- Release latex balloons only. Do not release “Mylar” foil coated balloons.
- Hand tie all balloons. Do not use plastic discs or clips to seal the balloons since these are not degradable.
- Any string attached to the balloons should be at least as biodegradable as the balloons.
- Do not release clusters of balloons attached together. Release individual balloons only.
- The Federal Aviation Authority should be contacted prior to any balloon release involving 500 or more balloons.
REFERENCES
- Discussion with David Tucek, Meteorologist, National Weather Service, Louisville, Ky. July, 1989.
- Standard Atmosphere Table, Mechanics of Fluids, Irving Shames, McGraw-Hill, 1962.
- General Meteorology, Horace Robert Byers, Sc. D., McGraw-Hill, 1959.
- Rubber Technology and Manufacture, C. M. Blow, Institution of the Rubber Industry, London, England, 1971.
- The Language of Rubber, E. L DuPont de Nemours & Co. Elastomers Chemicals Dept., Wilmington, Delaware, 1957.
- Pilot Experiments Concerning Balloon Ingestion by Sea Turtles; Peter Lutz; University of Miami; Miami, Florida.
- Physical Climatology – Second Edition; by Helmut Landsberg; Grey Publishing Co., Inc; Penn 1962 (Table 40, p. 127)
APPENDIX
1. CALCULATIONS OF THE MECHANICS OF A BALLOON RELEASE
Using temperature and pressure data vs altitude from the standard atmosphere table (next page) calculate the altitude at which an 11-inch diameter balloon will rupture. This is a trial and error calculation.
For a sphere, Volume V is
V = 4/3 pi r3 = 1/6 pi d3
When released, height Z = 0, diameter = 11″
Vo = 1/6 pi (11/12)3 = 0.403 ft3
Circumference Co is
Co = pi x d = pi x 11 = 34.54 in.
At this point the expansion of the balloon was measured at 540% elongation. At the elastic limit the circumference CB is
CB = 34.54 x 8.31 = 45.92″
The diameter at break DB is:
DB = CB / pi = 14.62″
Therefore the volume at break VB is:
VB = 1/6 pi (14.62/12)3 = 0.945 ft3
| Altitude ft |
Temperature °F |
Pressure in. Hg |
Pressure psf |
p/po* | c fps |
|---|---|---|---|---|---|
| 0 | 59.0 | 29.92 | 2,116 | 1.000 | 1,117 |
| 1,000 | 55.4 | 28.86 | 2,041 | 0.9711 | 1,113 |
| 2,000 | 51.9 | 27.82 | 1968 | 0.9428 | 1,109 |
| 3,000 | 48.3 | 26.82 | 1,897 | 0.9151 | 1,105 |
| 4,000 | 44.7 | 25.84 | 1,828 | 0.8881 | 1,101 |
| 5,000 | 41.2 | 24.90 | 1,761 | 0.8617 | 1,098 |
| 6,000 | 37.6 | 23.98 | 1,696 | 0.8359 | 1,094 |
| 7,000 | 34.0 | 23.09 | 1,633 | 0.8106 | 1,090 |
| 8,000 | 30.5 | 22.22 | 1,572 | 0.7860 | 1,086 |
| 9,000 | 26.9 | 21.39 | 1,513 | 0.7620 | 1,082 |
| 10,000 | 23.3 | 20.58 | 1,455 | 0.7385 | 1,078 |
| 11,000 | 19.8 | 19.79 | 1,400 | 0.7156 | 1,074 |
| 12,000 | 16.2 | 19.03 | 1,346 | 0.6932 | 1,070 |
| 13,000 | 12.6 | 18.29 | 1,294 | 0.6713 | 1,066 |
| 14,000 | 9.1 | 17.58 | 1,243 | 0.6500 | 1,062 |
| 15,000 | 5.5 | 16.89 | 1,194 | 0.6292 | 1,058 |
| 16,000 | 1.9 | 16.22 | 1,147 | 0.6090 | 1,054 |
| 17,000 | -1.6 | 15.57 | 1,101 | 0.5982 | 1,050 |
| 18,000 | -5.2 | 14.94 | 1,057 | 0.5699 | 1,045 |
| 19,000 | -8.8 | 14.34 | 1,014 | 0.5511 | 1,041 |
| 20,000 | -12.3 | 13.75 | 972.5 | 0.5328 | 1,037 |
| 21,000 | -15.9 | 13.18 | 932.4 | 0.5150 | 1,033 |
| 22,000 | -19.5 | 12.64 | 893.7 | 0.4976 | 1,029 |
| 23,000 | -23.0 | 12.11 | 856.3 | 0.4806 | 1,025 |
| 24,000 | -26.6 | 11.60 | 820.2 | 0.4642 | 1,021 |
| 25,000 | -30.2 | 11.10 | 785.3 | 0.4481 | 1,016 |
| 26,000 | -33.7 | 10.63 | 751.6 | 0.4325 | 1,012 |
| 27,000 | -37.3 | 10.17 | 719.1 | 0.4173 | 1,008 |
| 28,000 | -40.9 | 9.725 | 687.8 | 0.4025 | 1,004 |
| 29,000 | -44.4 | 9.297 | 657.6 | 0.3881 | 999 |
| 30,000 | -48.0 | 8.885 | 628.4 | 0.3741 | 995 |
| 31,000 | -51.6 | 8.488 | 600.3 | 0.3605 | 991 |
| 32,000 | -55.1 | 8.106 | 573.3 | 0.3473 | 986 |
| 33,000 | -58.7 | 7.737 | 547.2 | 0.3345 | 982 |
| 34,000 | -62.2 | 7.382 | 522.1 | 0.3220 | 978 |
| 35,000 | -65.8 | 7.041 | 498.0 | 0.3099 | 973 |
| 36,000 | -67.6 | 6.702 | 474.8 | 0.2971 | 971 |
| 37,000 | -67.6 | 6.397 | 452.5 | 0.2844 | 971 |
| Notes:*po = 0.002378 slug/ft3 | |||||
From: “Mechanics of Fluids”; Irving H Shames; McGraw Hill, 1962.
At the starting conditions,
Height = Zo = 0
Temperature = To = 60 °F = 520 °R
Pressure = Po = 29.92 inches Hg
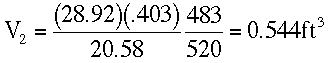
At Z = 10,000 ft.
Using the ideal gas law,
From Standard Atmospheric Table:
T2 = 23 + 460 = 483 °R
P2 = 20.58 in Hg
At Z = 20,000 ft.
T3 = -12 + 460 = 448 °RP3 = 13.75 in Hg
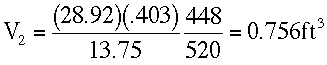
At Z = 30,000 ft.
T4 = -48 + 460 = 412 °RP4 = 8.89 in Hg
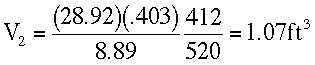
Therefore rupture occurs at about 28,000 ft.
2. DENSITY OF BALLOON FALL FOLLOWING A RELEASE
Assume Typical Balloon Release = 500 balloons. (Based on discussions with a number of balloon retailers in Louisville, KY)
Assume 90 percent of balloons rise to rupture height. (Based on observation that much less than 5% of tagged balloons get retumed.)
Therefore 10% (50 balloons) will fall intact.
Typical wind speeds at various altitudes are (Ref 1):
| Altitude | Average Speed at Altitude |
Average Speed Over Altitude Range |
|---|---|---|
| 0 (ground) | 7 mph | |
| 11 mph avg | ||
| 10,000 ft | 15 knots | |
| 20 mph avg | ||
| 20,000 ft | 25 knots | |
| 35 mph avg | ||
| 30,000 ft | 40-50 knots | |
| Notes:Jet stream; altitude = 35,000 – 40,000 ft; speed = 50 – 90 knots | ||
The balloon is ascending at about 10,000 ft each 1/2 hour based on the calculation of p. 4 of report.
Assume the balloons rise for 3 one-half hour periods, and then descend at same rate.
Also, a 30 degree spread following the release would appear to be reasonable on a calm day.
Total horizontal distance covered during flight is approximately
2 x (6 + 10 + 18) = 68 miles
The area covered by the release
A = pi (D2 / 4) x (30°/360°) = pi (1362 / 4) x (30/360) = 1210 mi2
Density is [(50 balloons) / (1210 mi2)] = one balloon per 24 square miles
To be conservative, round this to one balloon per 15 square miles.
Originally published by the Latex Rubber Institute of Malaysia
Web Version by Mark Balzer, 8/25/2000